Retail Funnel Tracker
Lead and sales tracking platform designed to businesses monitor and analyze sales conversions, including offline and in-store sales. Collect data, track leads, and sync information with analytics tools like Google Data Studio.
Lead and sales tracking platform designed to businesses monitor and analyze sales conversions, including offline and in-store sales. Collect data, track leads, and sync information with analytics tools like Google Data Studio.
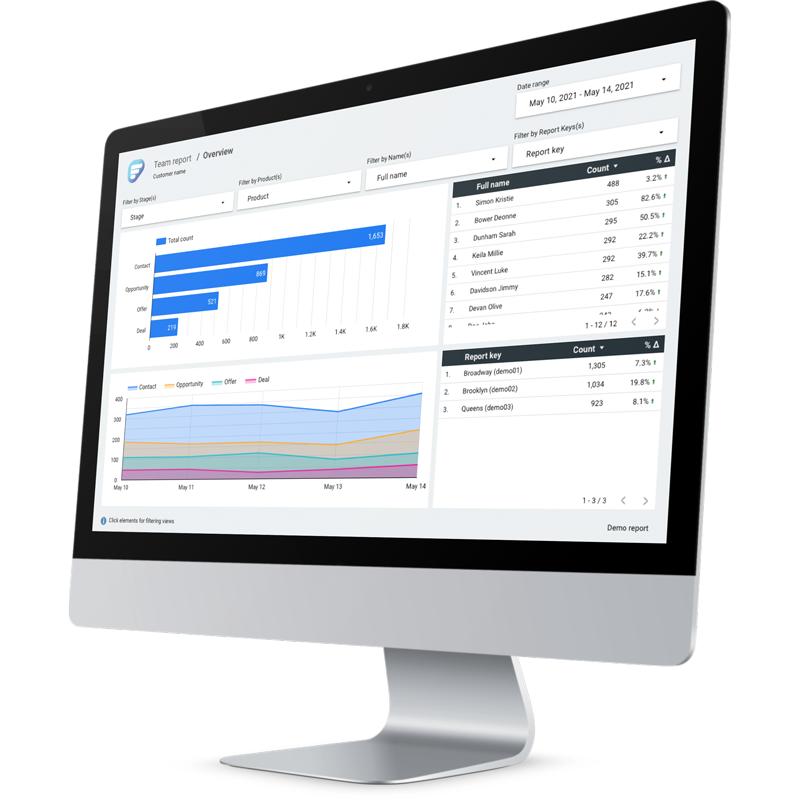
Informative dashboards are interactive and can be filtered into many levels of details. Our dashboards give valuable insight into teams sales activities. You have the option to decide who will get access to the dashboards. They can be used across various levels of your organization including sales team themself.
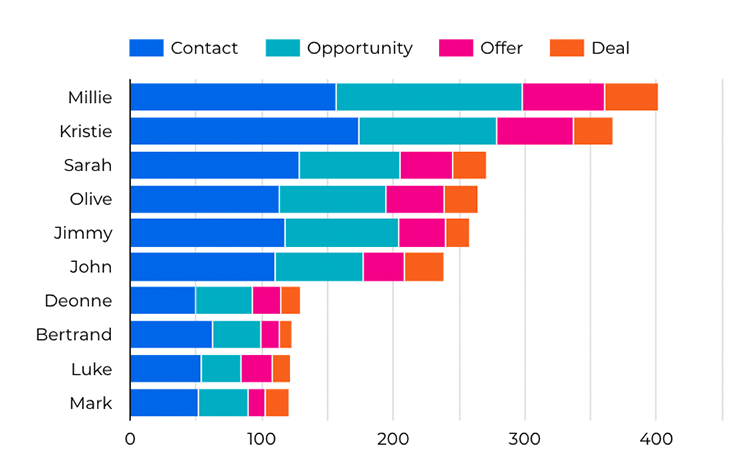
Combine and compare your teams performance
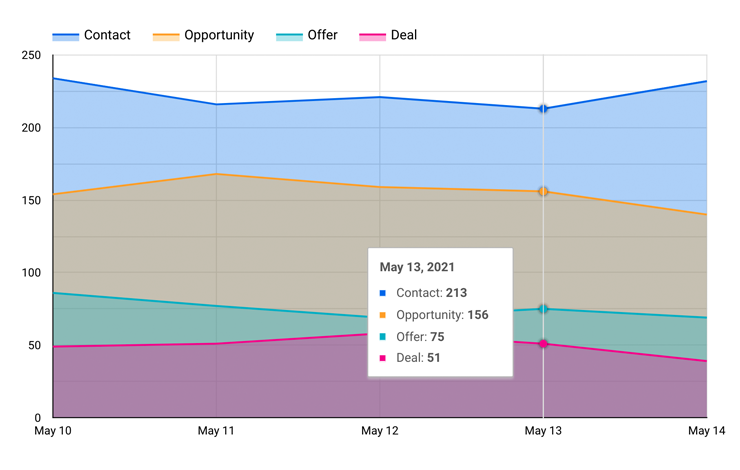
Choose your date range to view hourly, daily, weekly, or monthly data
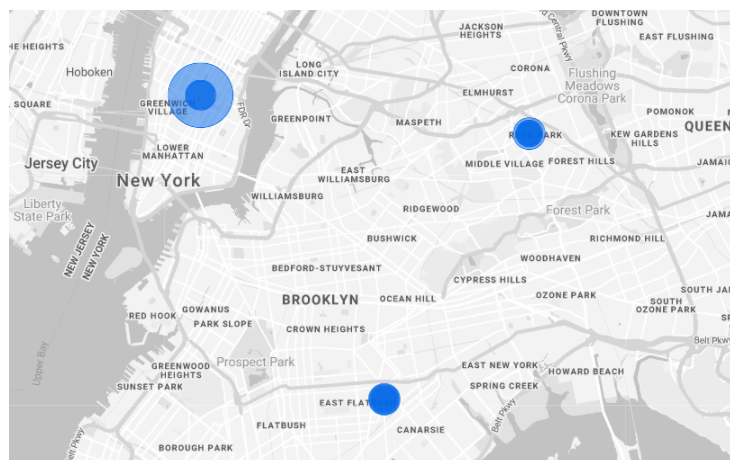
Visualize activities on a map to find out hotspots
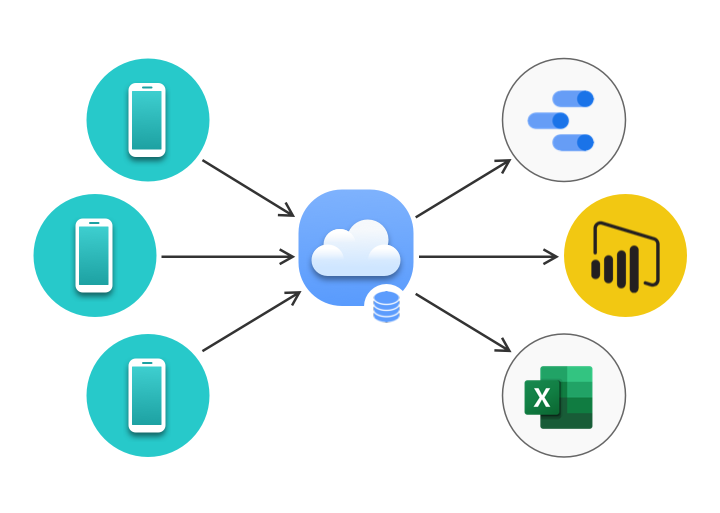
With our dashboard reporting feature data will be stored to Google data warehouse. Bring reporting data from Google BigQuery to your favourite analytics software or use our Google Data Studio templates as starting point for your dashboards.
Contact us for inquiries about our team features or support.